
Telephone - 01628 483 752
Company Registration No.07690054
- Welcome
- News & Events
- About Us
- School Life
- Canteen & Catering
- Careers Programme
- Duke of Edinburgh’s Awards
- House System
- Library
- Lockers & Bicycle Racks
- One to One Laptop Scheme
- Parents’ Evenings
- Prefects: Sixth Form & Year 11
- Safeguarding
- School Nurse
- School Transport
- Student Support and SEN
- Teacher Training
- Transition to Year 7
- Uniform, Hair, Jewellery, Phones
- 6th Form
- Curriculum
- Parent & Carers
- Attendance Guide
- Bucks Family Information Service
- Bucks School Transport
- Communication & Catering
- Friends of Great Marlow School
- Information Evenings
- Gift Aid
- Letters Home
- Mental Health Support
- Online Safety Resources
- Parent/Carer Services
- Progress Review Guides
- School Uniform Shops
- Special Educational Needs
- The Voice – School Newsletter
- Student Area
- Sport
- Gallery
Statistics
 ABOUT Statistics
Statistics are a part of our everyday world. Statistical information is used to influence major decisions in a wide range of sectors, from politics to pharmaceuticals, and from advertising to insurance.
Statisticians collect data, organise it, analyse it, and deliver an interpretation.
Those who understand the working of statistics have a greater questioning ability of the figures presented to us by experts. (Adapted from Top Universities website)
- Statistics at GMS
- Learning Ladders
- Key Stage 4 Statistics
- Key Stage 5 Statistics
- Careers in Statistics
STATISTICS AT GMS
Statistics is a fantastic choice for all GMS students who want to know the facts behind the figures and want to make sense of the world around them. It complements other subjects including biology, geography and business studies.
The logical, problem-solving and numerical skills gained are useful for many different areas of employment: from working with a Formula One racing team on aerodynamics, to stock market trading.
STATISTICS KS4 & KS5
KEY STAGE 4 STATISTICS (EDEXCEL 1ST0)
The GCSE Statistics foundation tier course, taught in the autumn term of Year 10, will consolidate much of the statistical learning in the GCSE Mathematics at higher tier. The GCSE Statistics higher tier course, taught later in Year 10 and in Year 11, will extend the students’ statistical knowledge and cover many of the topics taught in A-level Statistics and Mathematics.
Assessment
This newly reformed course will be assessed by two examinations; taken at the end of the two year course. Each examination will be equally weighted, with all topics potentially being tested on each paper. As the Statistical Enquiry Cycle is a major element of the course, students will complete a number of statistical investigations throughout the two year course.
There are two tiers of entry:
- Higher grades 9 to 4 (two 1½ hour examinations)
- Foundation 5 to 1 (two 1½ hour examinations)
It is expected that the vast majority of Great Marlow students will sit the higher tier examination.
Course Outline
The aim of this course is to increase students’ awareness of the role that statistical analysis can play in their lives. It deals with obtaining, representing and processing data in order to extract information and draw conclusions.
The course will cover the following areas:
- Planning a statistical investigation: hypothesis, planning an investigation, experiments/surveys, appreciation of constraints.
- Data Collection: types of data, obtaining data, census data.
- Sampling: conducting a survey/experiment.
- Representation: diagrammatic representation.
- Data Analysis: measures of central tendency and of spread.
Other summary Statistics includes Time Series, Quality Assurance, Correlation, Regression, Estimation and Probability.
Use of ICT
Extensive use is made of ICT throughout the course. Students will be able to download and install a copy of Autograph at home to support their learning.
Books/Guides/Website
It is expected that the examination board, Pearson/Edexcel, will produce a revision guide that will be available for students to buy in Year 11. There will also be a pack of past examination papers available in Year 11 to help students prepare for their two examinations.
In addition, there are a number of websites that will be used throughout the course. These include:
| Half Term | Topics & Activities | Assessment |
| Yr10 1 | • Introduction
• Data types (including ordinal) • Sampling techniques (including use on control groups) • Averages (ie mean, median & mode) • Spread (ie range & interquartile range (IQR) • Questionnaires • Probability 101 • Indexes including, Retail Price Indices (RPI), Consumer Price Index (CPI) & Gross Domestic Product (GDP) • Pie charts |
• Sampling question sheet
• Averages question sheet |
| Yr10 2 | • Box plots (including calculating skewness)
• Probability (including sample spaces, experimental, relative frequency & relative/absolute risk) • Correlation: scatter diagrams (including multi-variate data) • Stem & leaf diagrams • Frequency polygon • Cumulative frequency • Mayfield High Investigation • Misleading statistics (including misuse of frequency density formula) • Population pyramids & choropleth maps |
• Box plot question sheet
• Foundation Tier assessment |
| Yr10 3 | • Memory (Group) Investigation
• Probability trees |
• Memory Plan
• Memory data, processing & interpretation |
| Yr10 4 | • 6 feet investigation
• Road Transport Investigation Plan • Correlation: Spearman’s Rank (including interpreting Pearson’s product-moment correlation coefficient (PMCC) • Standard deviation 1 |
• Road transport plan
• Spearman’s rank question sheet |
| Yr10 5 | • Standard deviation 2
• Box plots & outliers (new calculation) • Data cleansing • Climate Investigation Plan • Climate Investigation (Stages 1, 2a, 2b) (sources need to be acknowledged) |
• Standard deviation question sheet
• Climate plan |
| Yr10 6 | • Climate Investigation (Stage 3)
• Time series • Assessment revision |
• Climate data, processing & interpretation
• Higher Tier Assessment |
| Yr11 1 | • Histograms
• Normal distribution (N(µ,σ2) notation, sample means being less dispersed) • Standardised scores • Standardised scores • Sampling revision • Mock investigation (Stage 1) • Mock investigation (Stages 2a, 2b & 3) |
• Mock plan
• Mock data, processing & interpretation |
| Yr11 2 | • Comparative pie charts
• Probability (including Venn diagrams, conditional & notation) • Binomial distribution (B(n,p) notation & no expansion given so use of calculator required) • Control charts • Spread (ie percentiles inter percentile range, inter-decile range) • Weighted & geometric means • Rates of change & gradients (eg line of best fit (LoBF) • Pearson’s capture recapture method • Mock revision |
• Binomial distribution question sheet
• Control charts question sheet |
| Yr11 3 | • Mock revision
• Mock examination • Final investigation plan • Final investigation (Stages 1, 2a, 2b) |
• Mock examination
• Final plan |
| Yr11 4 | • Final investigation (Stage 3)
• Interpreting complex tables • Probability distributions • Revision |
• Mock data, processing & interpretation
• AQA GCE Interpreting tables question sheet • GCSE past exam paper |
| Yr11 5 | • Revision | • GCSE past exam paper |
| Yr11 6 | • Revision | • GCSE past exam paper |
KEY STAGE 5 STATISTICS – Year 12 & 13 (This is a new course for 2017-19)
The reformed A-level Statistics qualification will appeal to the student who wishes to pursue study of a numerate post-16 subject, but may not want to study Pure Mathematics. It is designed to give an understanding of the calculation of statistical measures, as well as their application and interpretation, without requiring knowledge of Pure Mathematics beyond GCSE.
For example, no calculus techniques are required and questions that are essentially algebraic problems will not be set. The content has been selected to include statistical knowledge, skill and techniques, which are needed for the study of other subjects, such as biology, economics, geography, psychology and business studies.
Providing you do not wish to go on to study a degree that requires A-level Mathematics, eg Mathematics, Physics or Engineering, many students are likely to achieve a higher grade studying A-level Statistics, than A-level Mathematics.
With the reformed A-level, there will be much more emphasis on both the use of technology and in the Statistical Enquiry Cycle (SEC). As a result, students will be expected to use a graphical calculator and a number of statistical applications (eg Autograph). Students will also carry out a number of investigations during the course to help them to develop their understanding of the Statistical Enquiry Cycle (SEC).
For the majority of university degrees the A-level grade is much more important than the subject studied. Unless you wish to become a mathematician, physicist or engineer, A-level Statistics could help you get that all important university place.
How are the lessons taught?
There will be eight hours of lessons every fortnight. Students will be expected to do at least a further 16 hours of private study every fortnight.
How will the qualification be assessed?
There will be three 2 hour examinations at the end of the two year course.
- Paper 1: Data and Probability
- Paper 2: Statistical Inference
- Paper 3: Statistics in Practice (with focus on Statistical Enquiry Cycle)
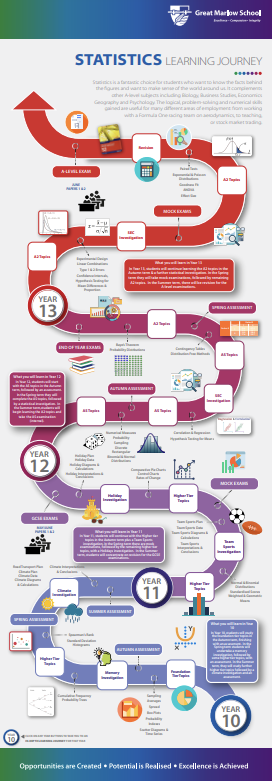
GCE Statistics Reformed (Edexcel) Scheme of Work (version 2)
Year 12
| Half Term | Topics & Activities | Comment | Assessment |
| 1 | • Introduction
• Numerical measures & interpreting data • Probability • Sampling • Probability distributions |
Times Series & Stem/Leaf Judgement & Snowball
Discrete and continuous |
Numerical measures
Probability Sampling Discrete probability Distribution |
| 2 | • Binomial distribution
• Normal distribution • Correlation & regression • Hypothesis testing for mean |
Binomial approximation Spearman’s rank & hypothesis testing
Known Standard Deviation Statistics development, or large sample & binomial proportion |
S1 Jun 2013 Exam Paper
Hypothesis Testing |
| 3 | Mock revision & examinations
Statistical Enquiry Cycle (SEC) Investigation |
5 stage cycle
Filter, sort, query & field |
AS Papers 1 & 2 mock examinations
SEC Plan SEC Investigation |
| 4 | • Contingency tables
• Distribution free methods |
Contingency tables
Distribution free methods (x3) |
|
| 5 | Revision
|
Year 12 Examinations
Practice papers (x4) |
|
| 6 | • Bayer’s Theorem (ATA)
• Probability distributions (CDA) |
To be advised |
Year 13
| Half Term | Topics & Activities | Comment | Assessment |
| 1 | • Experimental design
• Sampling, central limit theorem (CLT) & linear combination of independent random variables • Type I & II errors • Hypothesis testing for mean • Hypothesis testing for mean differences • Hypothesis testing for proportion • Confidence interval for means |
Risk of type II error
Know standard deviation development, large & small Large & small samples |
To be advised |
| 2 | • Paired tests• Exponential & poisson distributions
• Goodness fit |
Sign, Wilcoxon & paired t-test | |
| 3 | Mock revision & examinations
Statistical Enquiry Cycle (SEC) Investigation |
A2 Papers 1, 2 & 3 mock examinations
Statistical Enquiry Cycle (SEC) plan SEC investigation |
|
| 4 | • Analysis of variance
• Effect size |
No Latin Square
Cohen’s d – (the difference between two means, measured in standard deviations) |
|
| 5 | Revision | Practice papers (x4) | |
| 6 | A2 Examinations |
Careers in Statistics |
||
| Actuarial Science | Forensic Statistician | Pharmaceutical Statistician |
| Biostatistics | Government Statistician | Teacher/PA |
| Environmental Statistician | Healthcare Statistician | |
| Financial Engineering | Market Research Statistician |