Where
opportunities
are created
At Great Marlow School we nurture excellence, compassion and integrity
through an education that balances academic success with
personal growth and community engagement
through an education that balances academic success with
personal growth and community engagement
News
See all news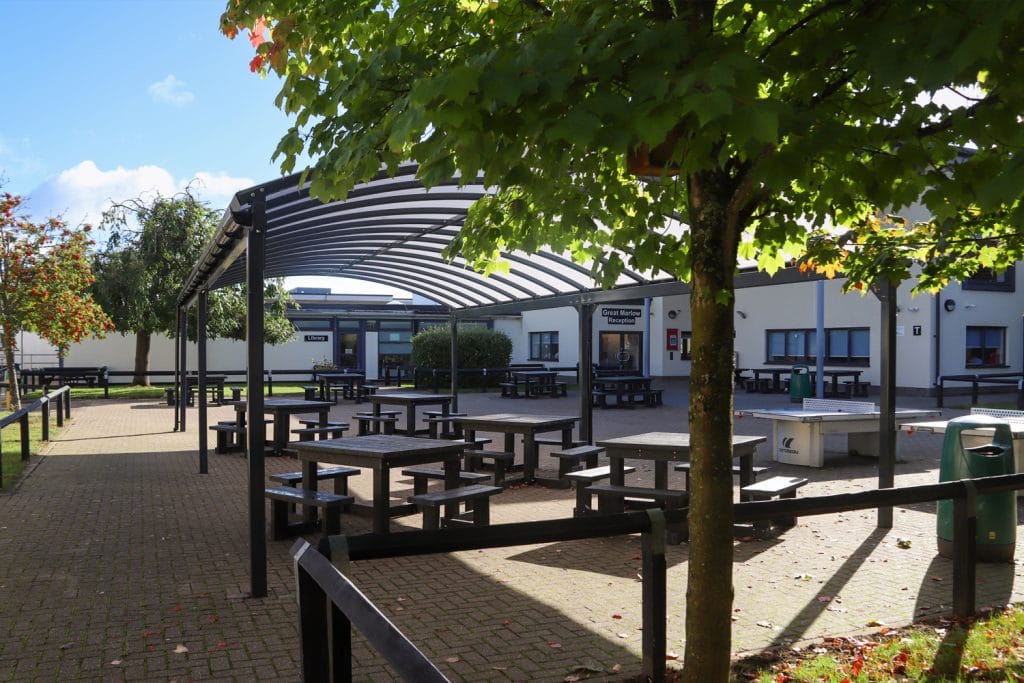
What's On
See all upcoming calendar events

Discover
GMS
Our vision is to offer a high-quality learning environment alongside a rich extracurricular programme.
Sixth Form ProspectusIntroducing 'My Personal Best' and our 7Rs
My Personal Best programme is integral to the school’s teaching and
learning philosophy, it promotes our 7Rs.
Follow us on Flikr to see what we are up to
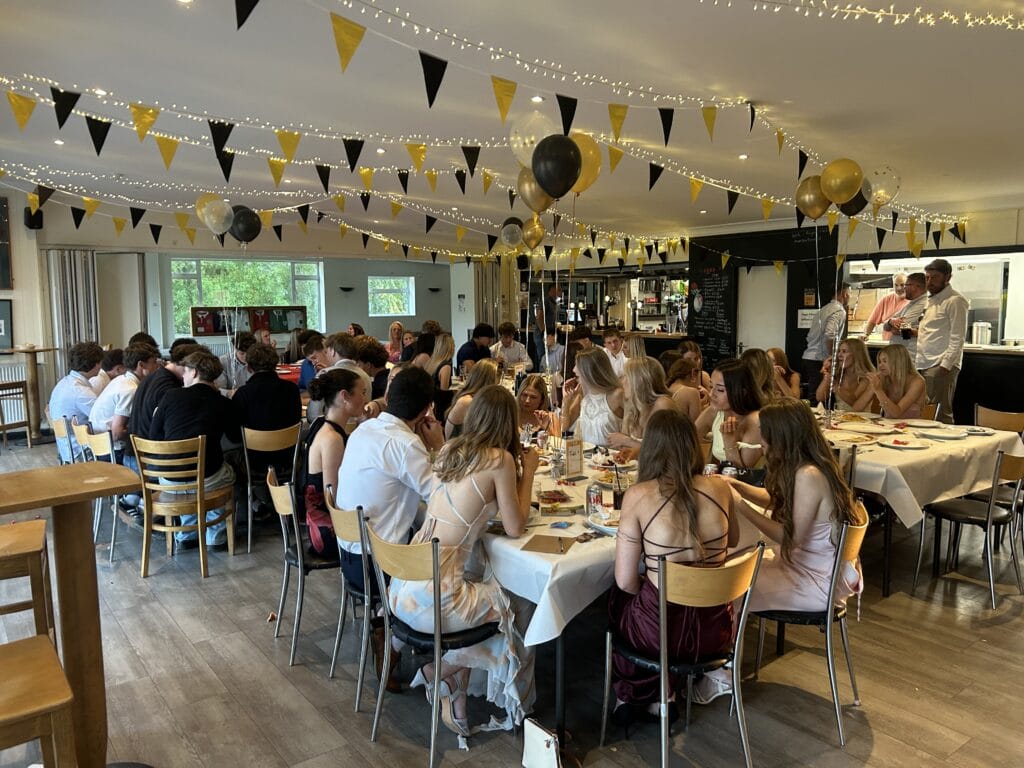
Our gallery is a great way to see GMS in pictures. From big events to small classroom activities: we like to share the 'great' in Great Marlow!
GMS has an outstanding history in rowing
Rowing is a sport of choice at GMS. It has an outstanding history, our excellent sports centre is named after Sir Steve Redgrave.
We are an inclusive school for sport
GMS is proud of the diversity of sporting activities offered, and the successes achieved in competitive fixtures.
Our termly publication incorporating departments' latest news
Parents and carers are sent a link to access the current edition of 'The Voice' It can also be viewed by clicking here.
GMS in Numbers
1399
Number of Students at GMS
97 %
Parent/carers would recommend our school
65
Trips and visits last academic year
73 %
Students participate in an extra-curricular activity
658
Sporting fixtures were undertaken last year
96 %
Parents/carers say their child is happy at GMS
House Points

166,684

166,715

165,666